Behind everything a business does, customers remain the focal point. Why? Because every product they sell or every service they offer, it is for customers (ultimately).
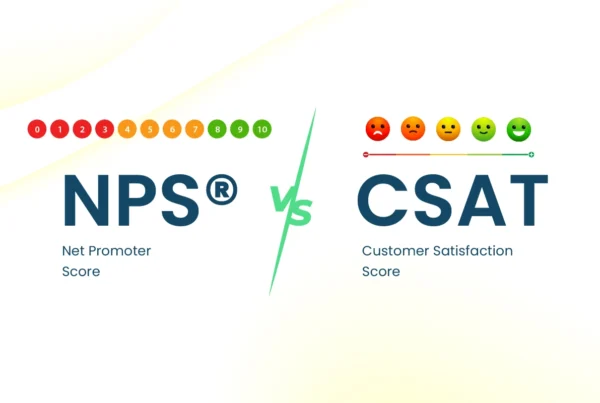
To know if customers are satisfied with your product, service, or any interaction, there is CSAT metric. Then, how to know if your customers are loyal to your brand? NPS® is the solution. Net Promoter Score® helps you measure overall satisfaction and customer loyalty to your brand.
What is NPS®? How to calculate NPS® score? What is a good NPS® score? We will discuss more about this customer experience metric below.
What is Net Promoter Score®?
NPS® or Net Promoter Score® is one of the most popular customer experience metrics. It was developed by Fred Reichheld (a partner at Bain & Company) in 2003 to measure how companies treat their employees and it impacts the overall loyalty. In short, NPS® metric is one of the best, easiest, and simplest ways to measure customer loyalty.
Examples of NPS® questions:
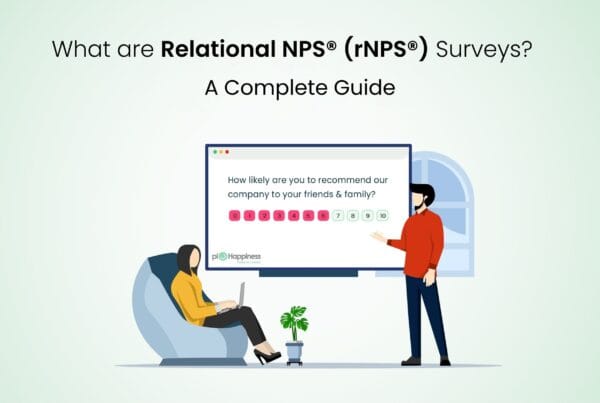
The standard NPS® question goes like:
How likely are you to recommend our company to a friend or colleague?
However, you can also ask NPS® questions like below:
- How likely is it that you would recommend our (product, service, or company) to a friend or colleague?
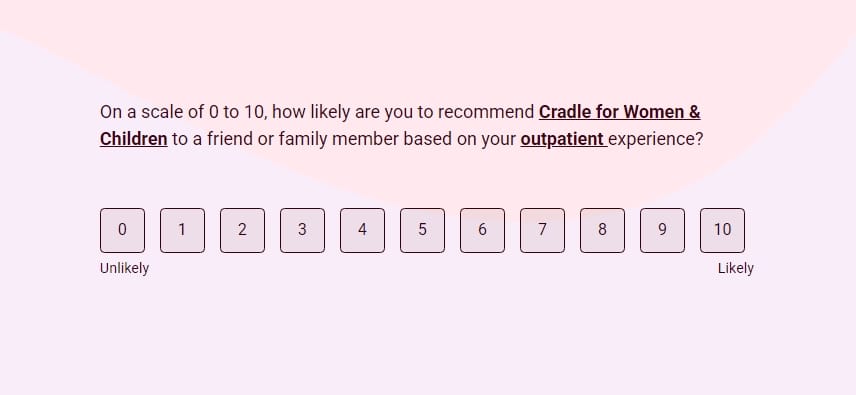
- On a scale of 0 to 10, how likely are you to recommend our company to others?
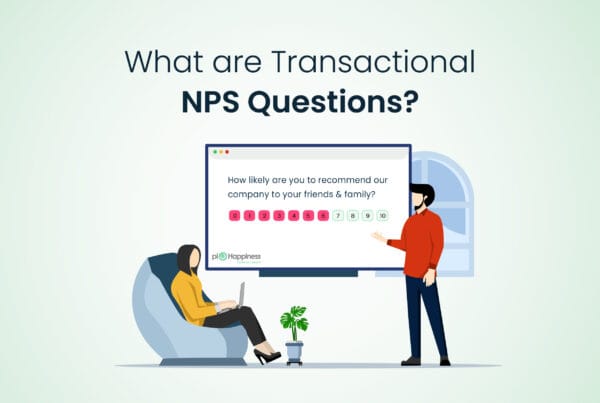
- Based on your recent purchase, how likely are you to recommend our product to your colleagues or friends?
- After your recent interaction with our IT team, how likely are you to recommend our company to others?
What is eNPS® (Employee Net Promoter Score®)?
eNPS® or employee Net Promoter Score® is another metric specifically used by organizations in order to measure employee engagement and loyalty. For instance, using eNPS®, businesses can know how likely their employees are to recommend the company as a good place to work for others. This metric shows how satisfied and loyal employees are to the company.
Why is NPS® so important?
Net Promoter Score® is a standard customer experience metric that helps you measure customer loyalty instantly. You can compile and track the score and set internal targets to see if the score is improving over time.
NPS® surveys are quite short and do not take much of your customers’ time. This increases the response rate and minimizes survey fatigue. On the other hand, NPS® data is relatively easy to analyze. After conducting the survey using a Net Promoter Score® tool, you can see the overall score and number of promoters, passives, and detractors.
By adding text-based follow-up questions after the NPS® question, you can gather the reasons behind the score. If a customer gave a poor score, you would know what drove them to give the low score and act accordingly to close the customer feedback loop. You can use this data to improve the product/service and enhance the customer experience.
NPS® Scale: Promoters vs. Passives vs. Detractors
NPS® scale ranges from 0 to 10, from which the respondent needs to choose.

When you look at the NPS® results, you can see promoters, passives, and detractors. But who are these? What do they even mean?
1) Promoters (Score: 9 and 10)
They usually give either a 9 or 10 score, and you can think of them as highly satisfied customers. Why? Because they are highly satisfied with your product/service and company and are likely to recommend it to others. According to Bain & Company, it was revealed that promoters are responsible for more than 80% of positive referrals.
2) Passives (Score: 7 and 8)
Passives are customers who are somewhat satisfied with the product/service but feel like there is still room for growth. They usually do not engage much and are not likely to recommend the company either. In short, they neither promote the brand nor engage in negative word of mouth but are more likely to switch to other brands.
3) Detractors (Score: 0 to 6)
Detractors are those who are dissatisfied (or extremely dissatisfied) with your product/service and company. They usually give between 0 and 6. They are highly likely to damage your brand image due to negative or poor referrals. Bain & Co found that almost 80% of negative word of mouth comes from detractors. So, if you are not paying attention to them, your business could be in trouble down the line.
4) How to calculate the NPS® score?
There is a simple formula to calculate the NPS® score, which goes like this:
NPS® score = percentage of promoters – percentage of detractors
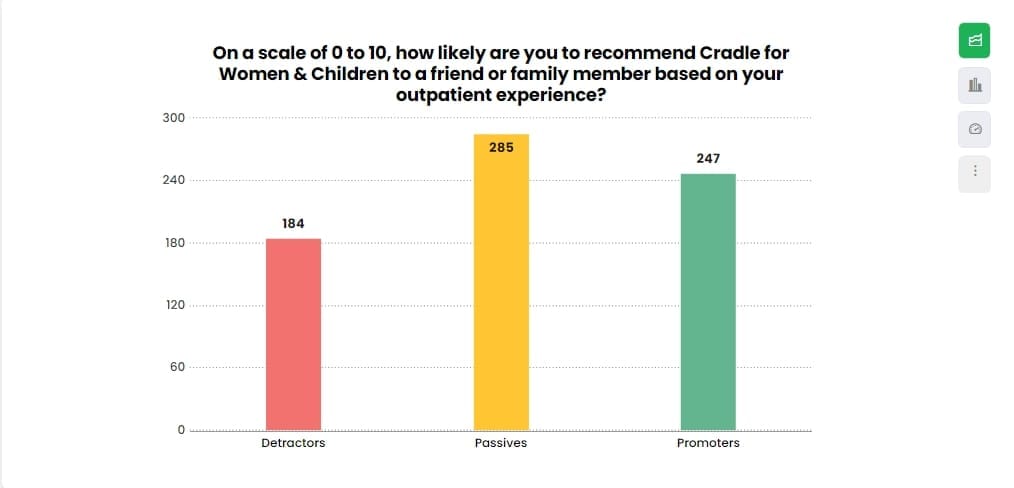
Example: Let’s assume the following survey data:
- Total Responses = 733
- Number of Promoters = 247
- Number of Passives = 285
- Number of Detractors = 184
Step 1: Calculate Percentages
To find the percentages, divide the number of promoters and detractors by the total responses:
- Percentage of Promoters = (247 / 733) * 100 = 33.7%
- Percentage of Passives = (285 / 733) * 100 = 38.9%
- Percentage of Detractors = (184 / 733) * 100 = 25.1%
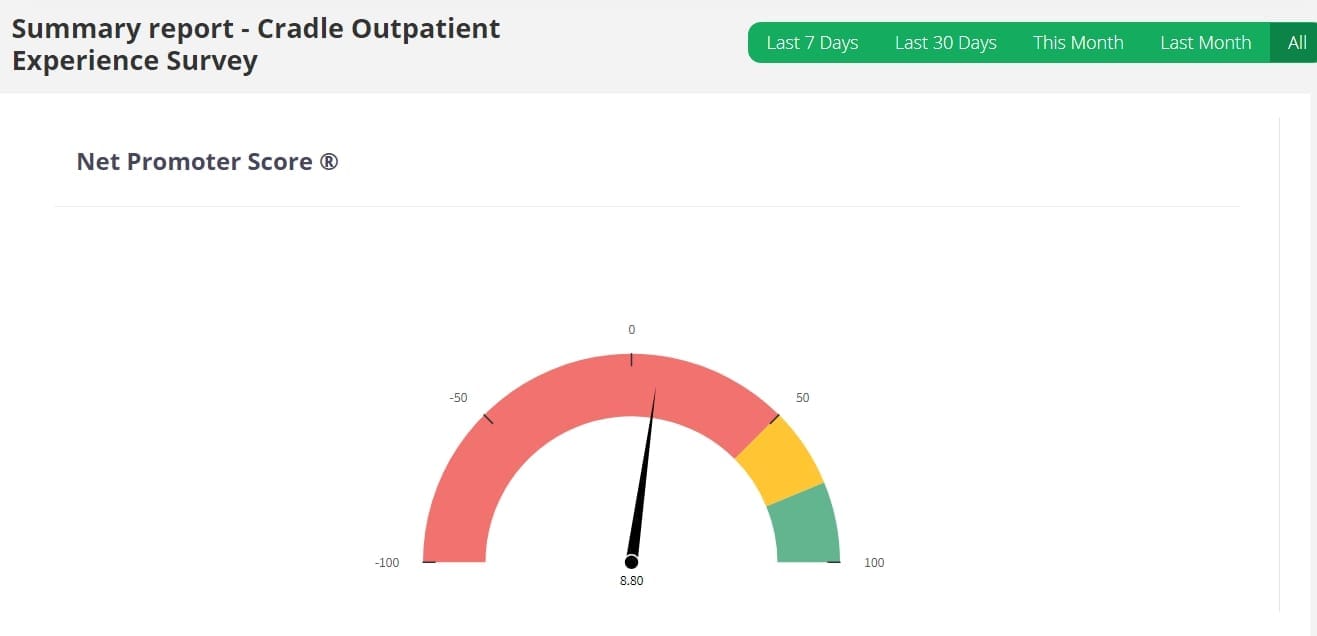
Step 2: Calculate NPS®
Now, use the formula:
NPS® Score = 33.7% (Promoters) – 25.1% (Detractors) = 8.6
If you have noticed, you can see that the passives (those who give a 7-8 score on the NPS® scale) are not included in the final NPS® calculation. Why is that? While passives are considered neutral, they don’t contribute positively or negatively to the score. They only influence the overall percentage, reducing the proportions of promoters and detractors.
What is a good NPS® score?
Let’s say that you conducted an NPS® survey and are analyzing the feedback. Are you wondering, “Is my NPS® score good?”
To be honest, there is no official score that is considered good, as it varies from industry to industry and company to company.
However, a score below 0 is often considered a bad NPS® score because you have more detractors than promoters. This means the majority of your customers are not satisfied and are likely to spread negative word of mouth. As a result, your brand reputation will be damaged, customer churn rate will increase, leading to business loss.
A score between 0 to 20 is often a good start as you have slightly more promoters than detractors. By asking follow-up questions, you can easily find customers’ pain points and areas where improvement is needed. This will help you meet your customers’ expectations, enhance loyalty, thereby increasing the NPS® score.
NPS® score between 20 to 40 is the average score for companies in different industries. Many of your customers are satisfied with your product/service and are likely to recommend your company to others. However, there is still room for improvement and better customer experience.
If your NPS® score is between 40 to 70, you are doing a great job. This means the majority of your customers are very satisfied and are loyal to your brand.
Scores above 70 are considered top tier (but they are rare, very rare).
Create NPS® surveys with piHappiness
After reading this, if you want to conduct NPS® surveys, you should check out piHappiness. It is a customer experience platform integrated with advanced survey and feedback features. With piHappiness, you can:
- Choose from pre-designed industry-specific NPS® survey templates
- Send NPS® surveys via multiple channels
- Gather real-time feedback
- Get detailed insights on promoters, passives, and detractors
- Receive instant AI-driven analytics
- Manage everything under one platform
Schedule a demo right away or contact us to send your personalized requirements.